Management control · hospitality
Olivar: the management dashboard of a hospitality group
A group with several venues wants to know every week how much each one earns and whether the cash will hold, without waiting for the accounts to close.
Demonstration project. Fictional brand, data and prices. We built it to show how we work: everything works and you can try it.
Try the demo ↗Service: Management and financial analytics systems
The brief
The numbers arrive late, in separate spreadsheets per venue, and the owner learns about problems when they are already costing money.
What we built
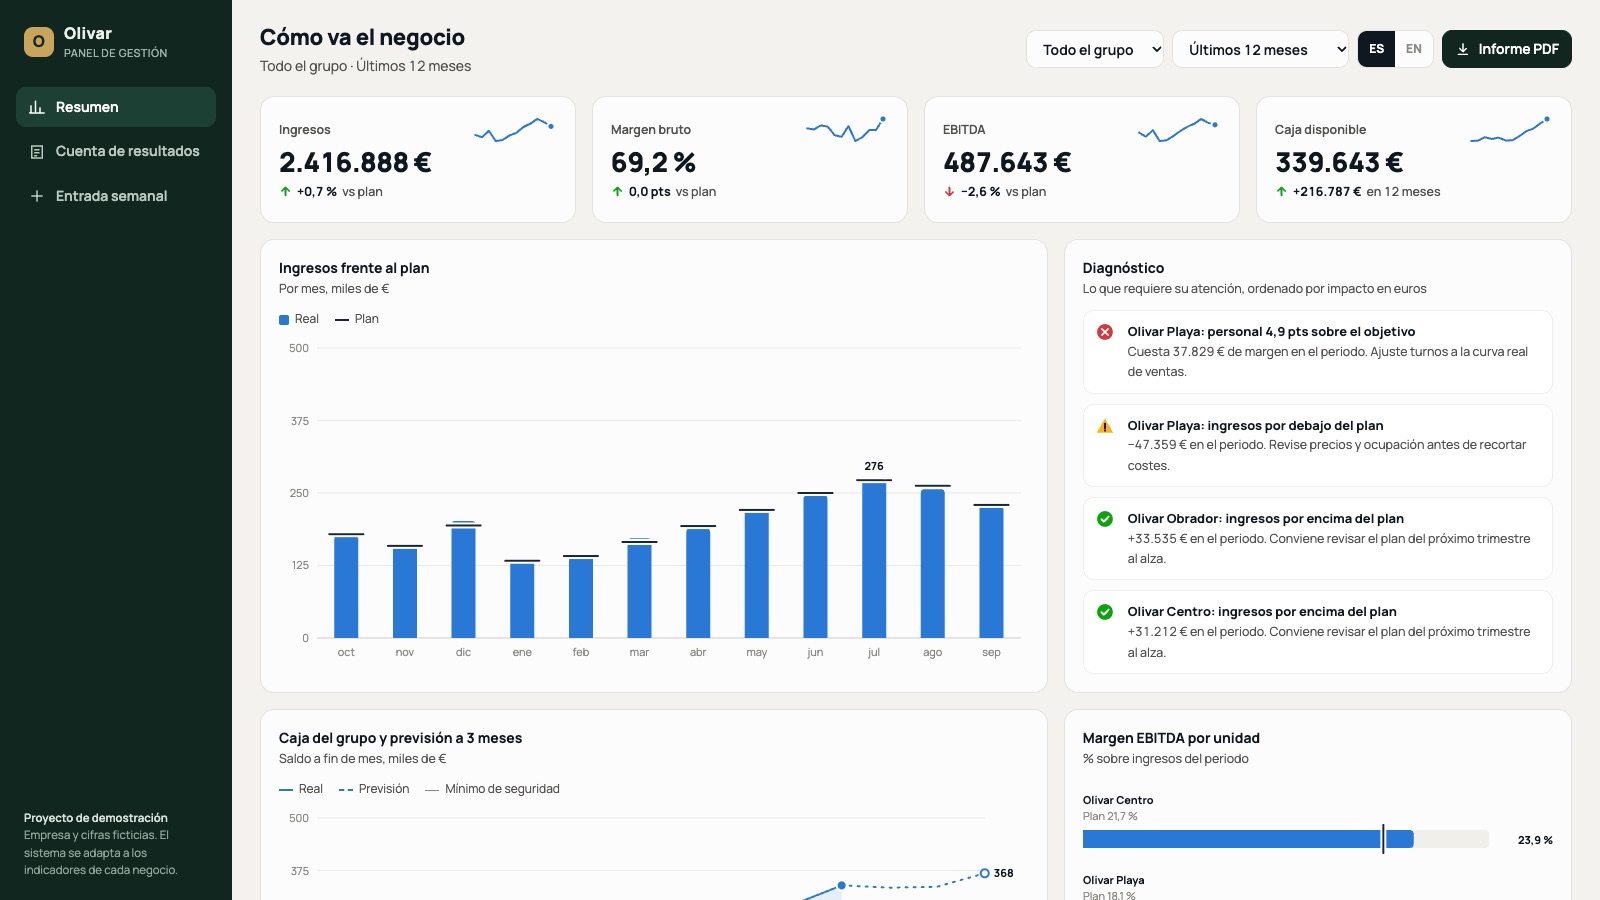
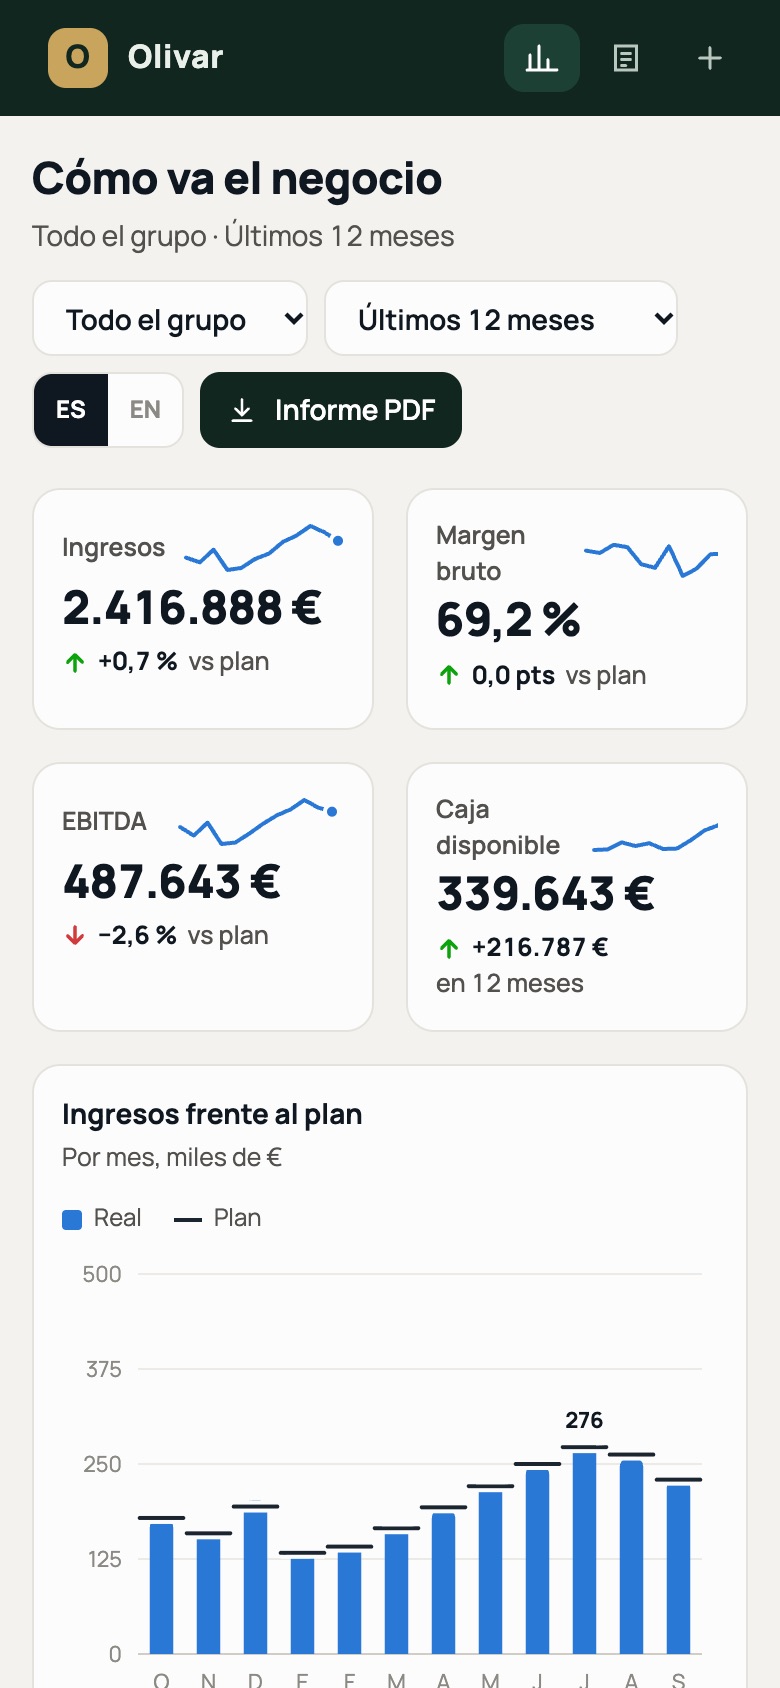
- Revenue against plan, month by month.
- Group cash with a three-month forecast and a safety minimum.
- EBITDA margin by business unit.
- A list of what needs attention, ranked by its impact in euros.
- Actual P&L against budget and key ratios with their targets.
- Quick weekly entry: three figures per venue; ratios, variances and the report are calculated automatically.
What the business gains
Decisions every week on numbers you can trust, instead of surprises at the end of the quarter.
Technology
A web application with real calculations on fictional data: change the unit or period, add a week and generate the report.